
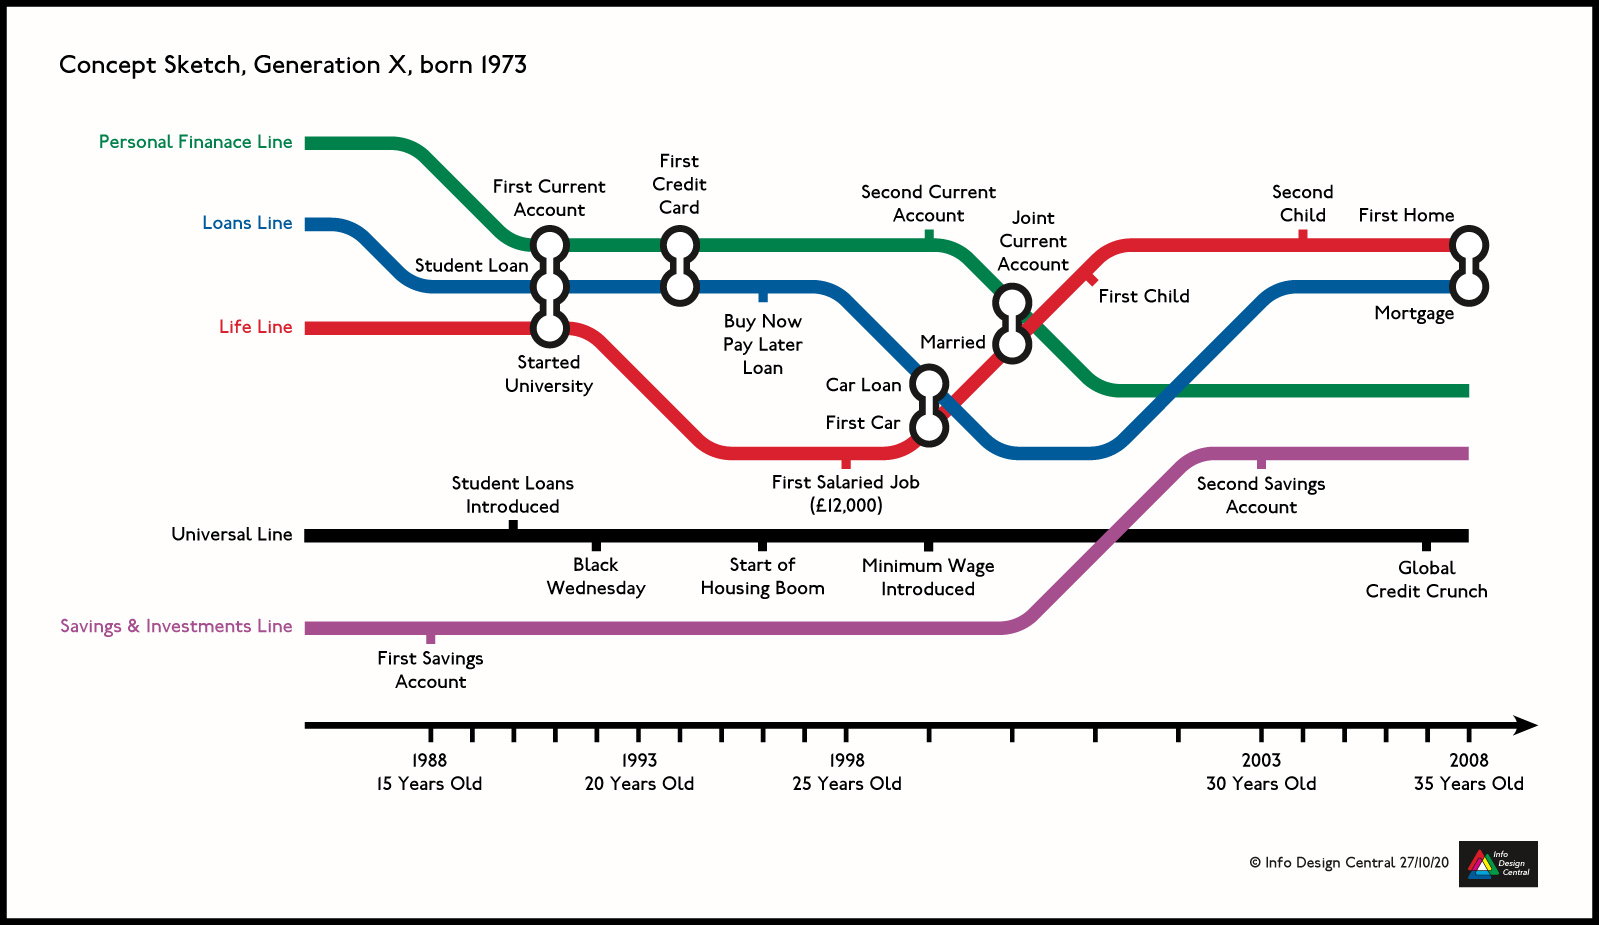
I was approached by Aberfield on behalf of firstdirect bank, in 2020, to investigate the application of the transit map metaphor to show people’s lifetime personal finance journeys. The original concept was to explore the potential for maps to highlight how people manage and view their personal finances, and how this differed between generations, with attention focused on financial landmarks and life events.
 From Prototypes to Specification
This project was undertaken jointly with TradePeers Ltd under the guise of Info Design Central. In early meetings with the client we discussed the strengths and weaknesses of the transit map metaphor and the sorts of data and connectedness between concepts that this is best suited to showing. We also created prototypes based on fictitious data to demonstrate how different concepts might be visualised. From this we agreed these specifications.
-
Four maps would be created, one for each generation: Baby Boomer; X; Millennial and Z.
-
Each map would depict four lines showing the mean age of attainment for various milestones: Life Events (e.g., first job), Personal Finance (e.g., first current account), Loans (e.g., first mortgage)
and Investments (e.g., first ISA). -
Independently of the personal events lines, a Financial Events Line would bind the four maps together by showing important national and international occurrences year by year.

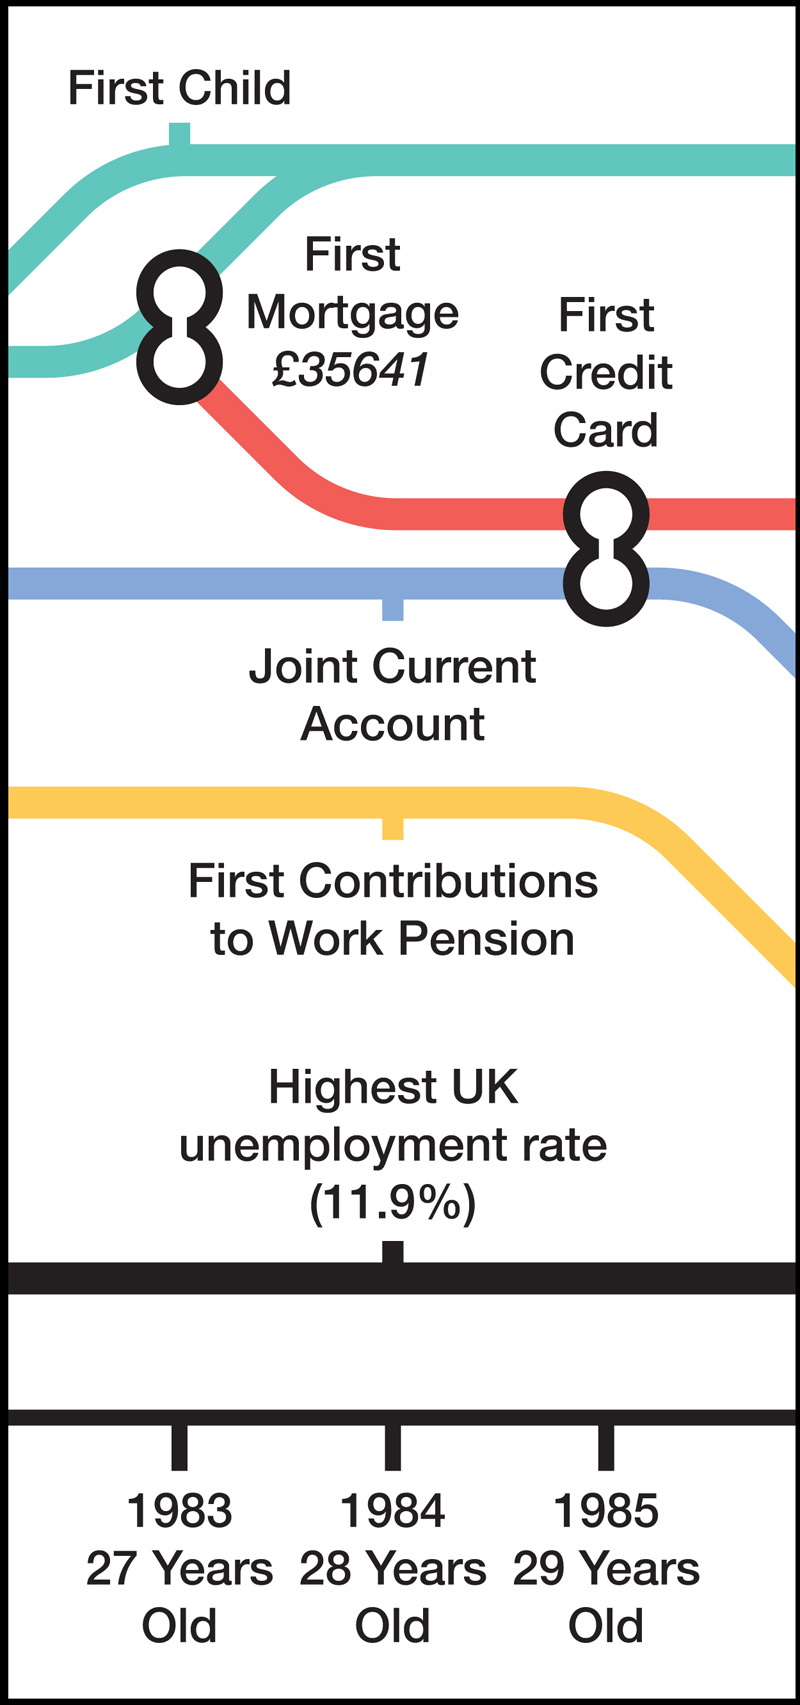 Each map would be grounded with a timeline commencing at the mean age of birth for members of that generation, and this would also show their mean age for each subsequent year.
Milestones would be shown by stations on the lines. Interchanges would be used for milestones which belonged to more than one
line conceptually (e.g., first credit card on the Loans Line and
the Personal Finance Line).For ages where key events had occurred simultaneously, but which were not related conceptually, lines would branch.
Where events had not yet happened, respondents would be asked to predict age of occurrence and these would be shown by lines ‘under construction’.

-
Info Design Central collaborated with Aberfield in constructing the main research survey,
identifying question formats that would give data that could be most easily shown on
maps and also by suggesting appropriate questions to ask. -
Info Design Central identified suitable stations for the Financial Events Line, with a mixture of national and international events, and with each decade well-represented (some have been more tumultuous than others). The intention was to provide a backdrop of headlines that would be universally recognisable and relevant to people’s lives decade by decade.
-
Info Design Central analysed data from over 4000 respondents, producing matrices of lifetime events/mean ages of attainment for each generation. Milestones were only depicted as stations
on the map if they were reported by at least 48% of respondents (a substantial minority). Matrices were checked for internal consistency (for example First Car Loan should not precede First Car). -
Once the matrices were signed off by Aberfield, and certain parameters agreed, map construction commenced. The major innovation was to stretch the scales of the timelines to accommodate financially busy periods of people’s lives – their earlier decades. To ensure that the maps could easily be compared, the range was expanded in an identical way for Baby Boomer–Generation X and for Millennial–Generation Z.
 Outcomes
The finalised maps were handed over (as Illustrator files) in April 2021. In a similar way
to other map construction projects, a number of intriguing insights revealed themselves during the construction process across generations.
-
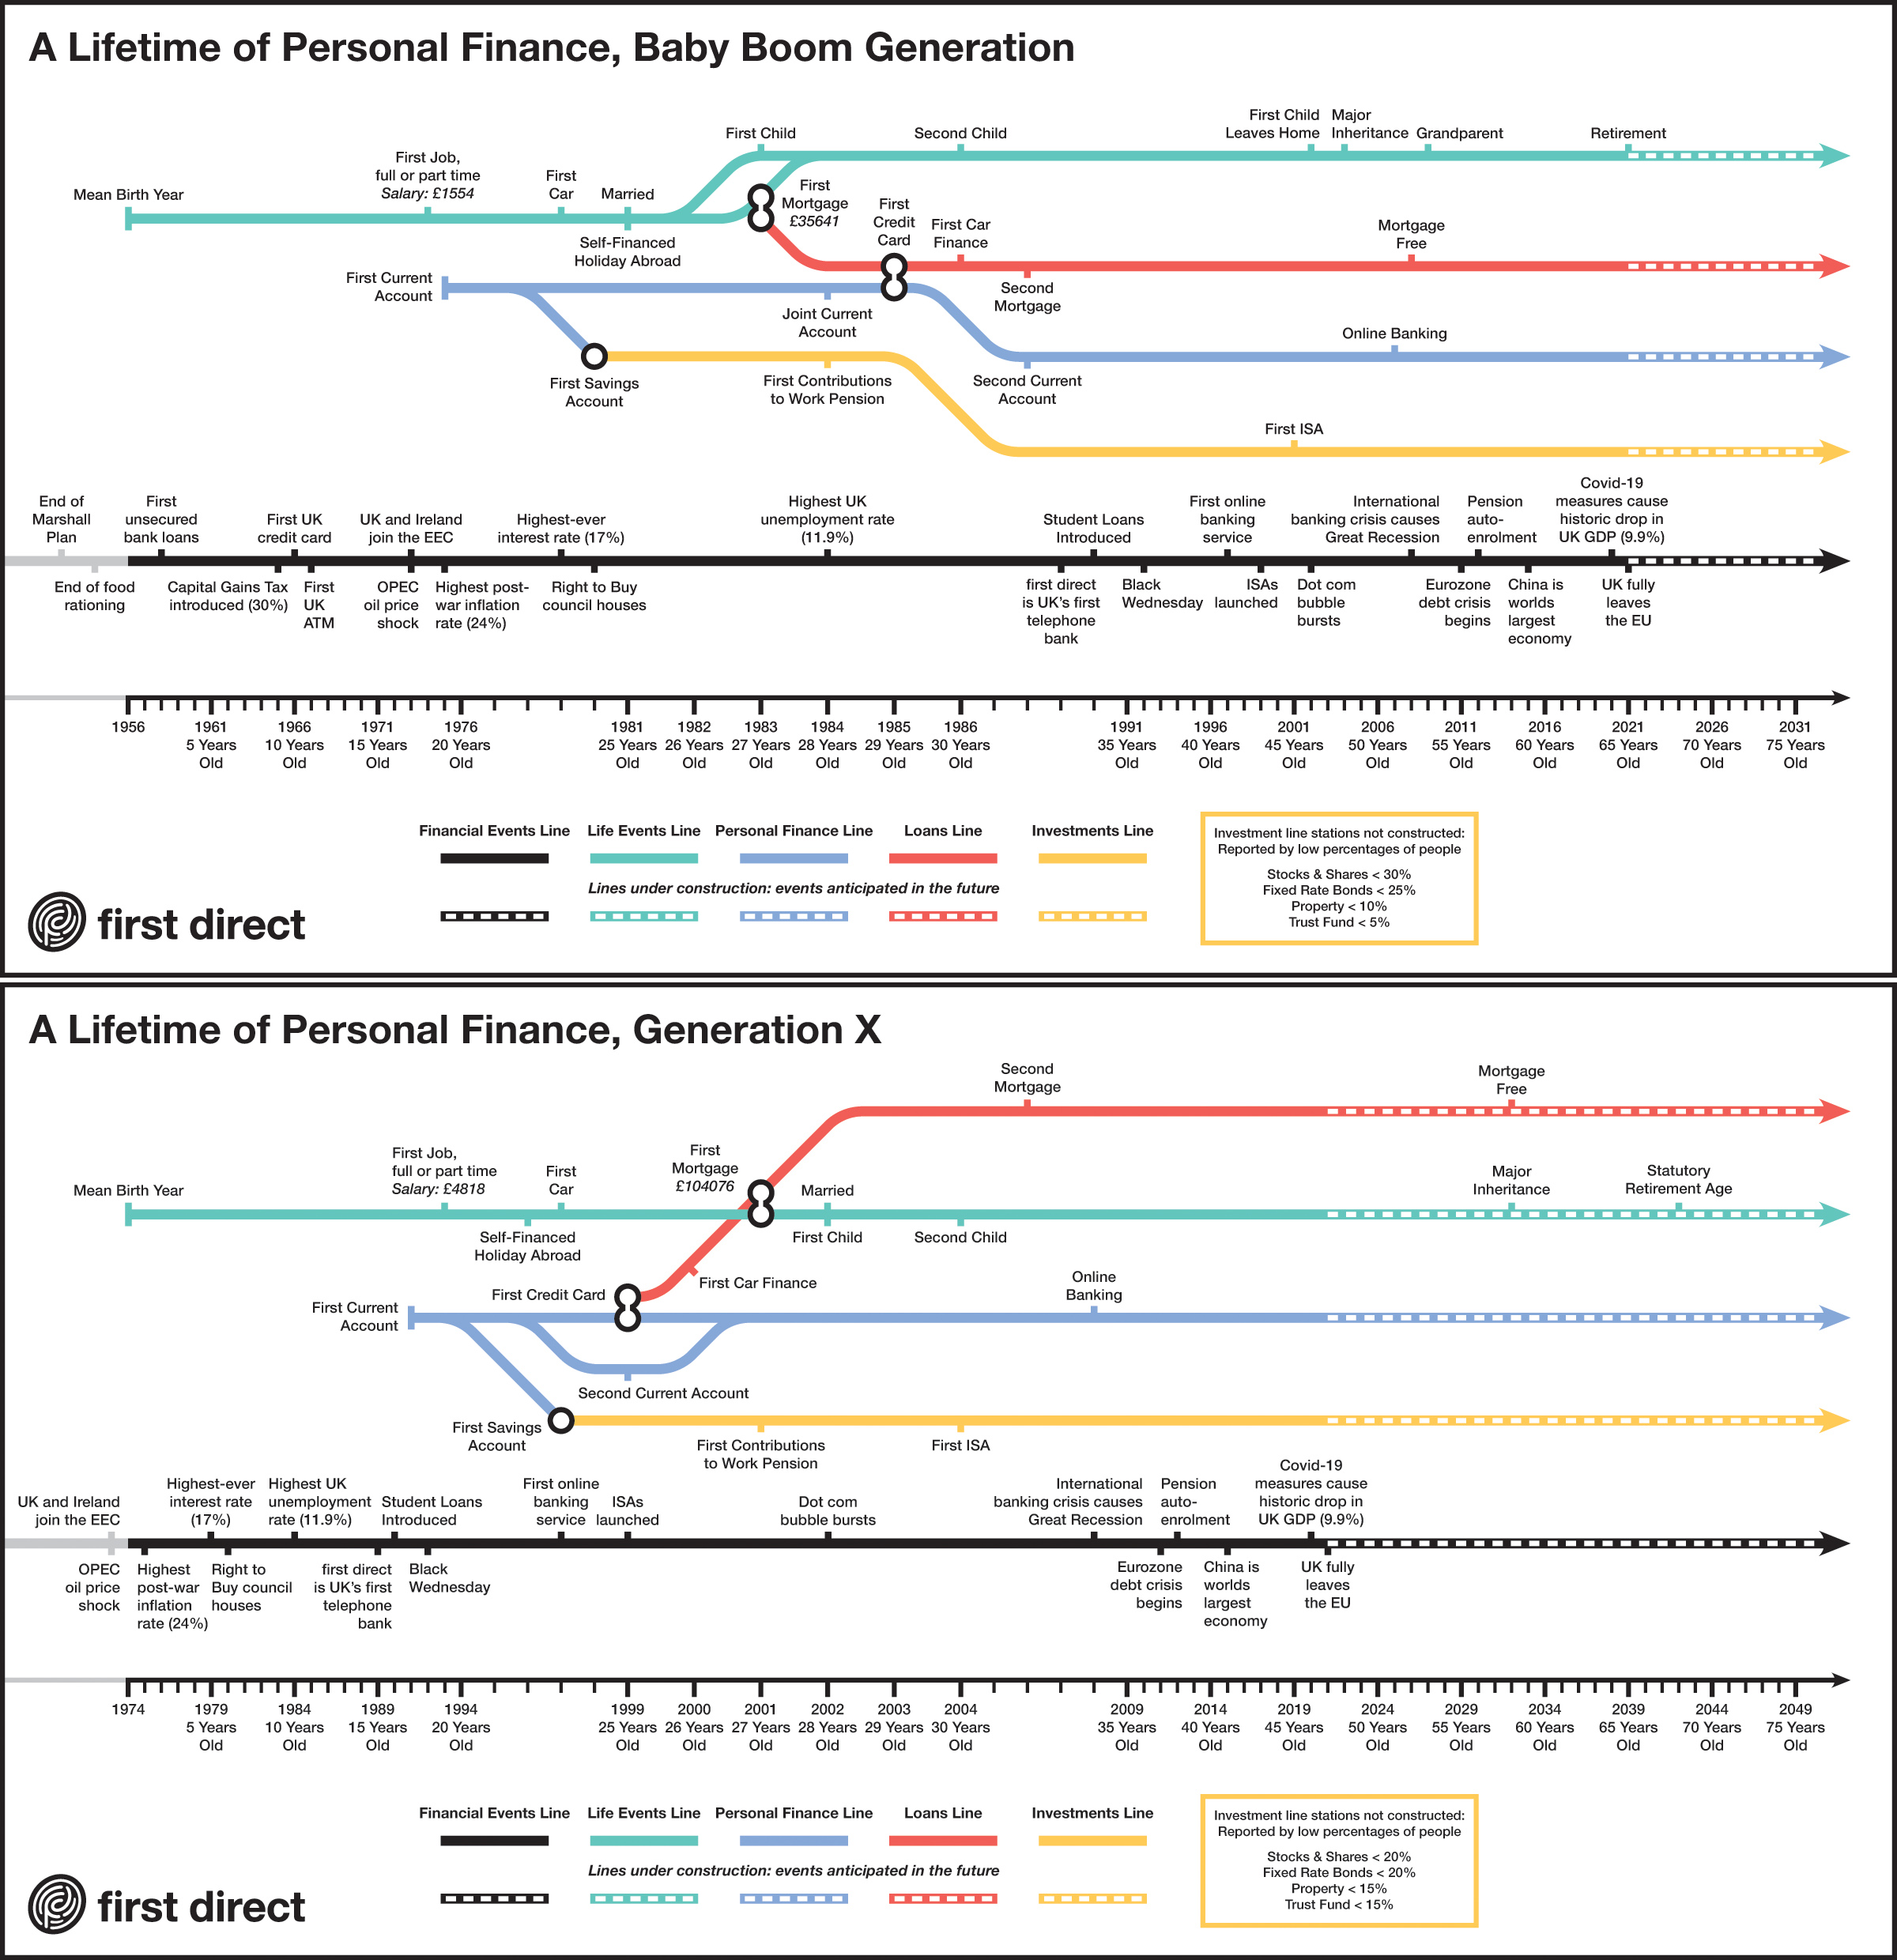
The Baby Boom generation tended to be late adopters of financial solutions, such
as credit cards, suggesting a repeating pattern of wait-until-needed, rather than taking new financial products as soon as they became available. -
In contrast, Generation X were much more likely to borrow and spend earlier, before settling down.
-
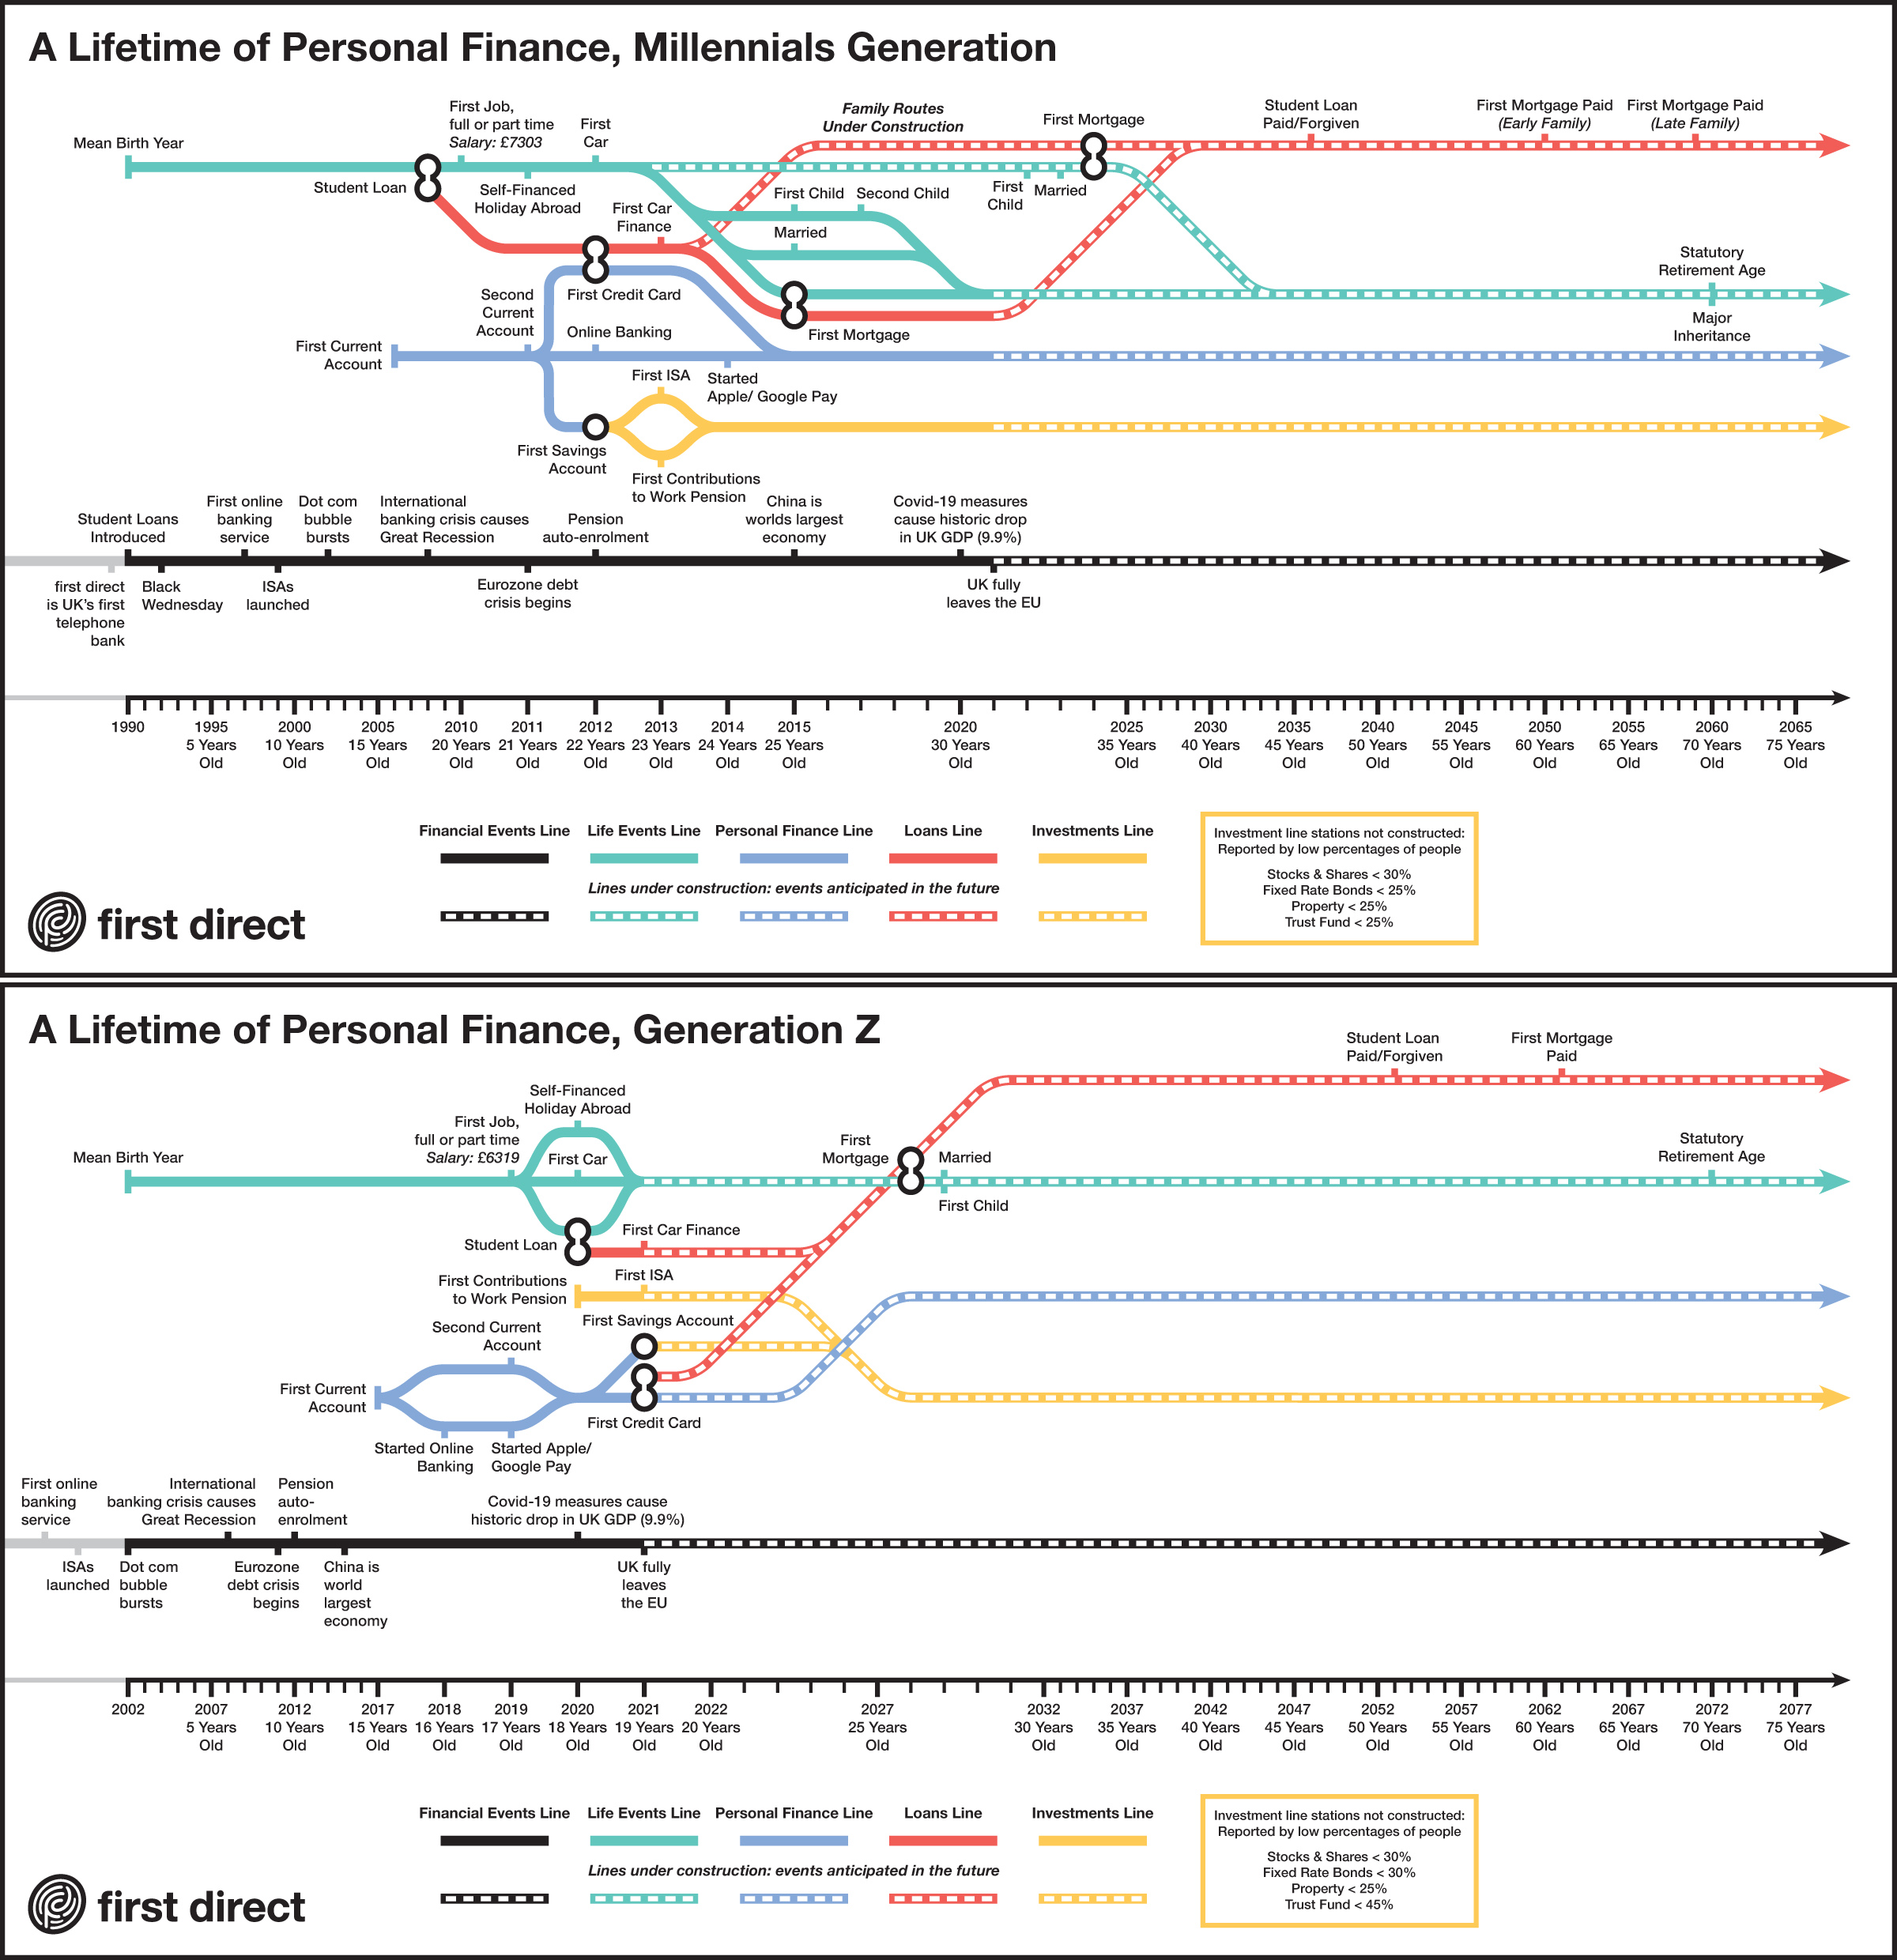
For Millennials, major decisions had been delayed until after university, but there seemed to be two distinct groups: settling down early versus settling down late. Early settlers were married with children by 25, whilst later settlers were yet to reach these milestones, but expected to achieve these in their thirties.
-
Gerneration Z seemed to be responding to
the uncertain future with speed, experiencing personal finance milestones, taking financial decisions and acquiring products far sooner than previous generations, along with earlier expectations for the future.
Overall, although the maps were rigorously and logically constructed, we never lost sight of the prime purpose of the exercise, which was to create engaging representations that would
get potential bank customers thinking about their own lives and how these related to the other generations, hopefully with the purchase of financial products following. The maps were intended as a marketing tool but basing them on sound data and aiming for coherence lent them an authoritativeness that strengthened their messages and impact.